Brief Summary
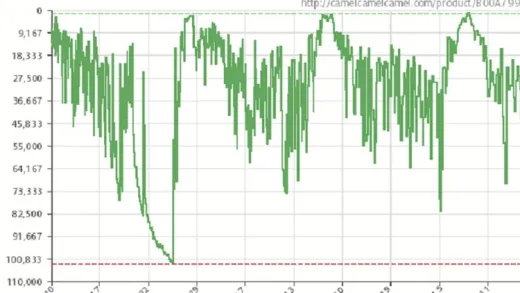
This course teaches you how to leverage free charts like Keepa and CamelCamelCamel to make smarter sourcing decisions for your Amazon FBA business. You'll learn all about sales rank and practical techniques to boost your success!
Key Points
-
Learn how to use free charts for product sourcing
-
Understand the importance of sales rank and its relation to price
-
Discover case studies and real-world examples
Learning Outcomes
-
Understand how to read and utilize Keepa and CamelCamelCamel charts
-
Make informed sourcing decisions using price and demand predictions
-
Think like a pro FBA reseller to enhance your e-commerce strategies
About This Course
Become better at Amazon FBA sourcing by using free information from charts to predict and forecast prices and demand.
This course is about use free charts ( Keepa and CamelCamelCamel) to make better sourcing decisions for Amazon FBA sellers.
You should be an Amazon 3rd party seller of plan on being an Amazon 3rd party seller to make use of the information that is taught in this course.
This course consists of over 2 hours of video lessons.
In this course you will learn about sales rank and why it isn't as important as many people think.
We look at different ways to check sales rank among different free tools and how accurate the tools are. We also look at ways to come up with a usable sales rank when a product sales rank bounces around a lot.
Next you will learn about the different features that both charts offer. There are lot of features that many people over look or don't understand how to use.
After covering the basics of how to read the charts and the plus and minus of each one, we move into case example on using charts in the real world and the thought process that I use when sourcing.
In the first example we show an example of how a very basic check of the charts would help to avoid a product sourcing error.
The next example show that sales rank is related to price and how high sales ranks are not always a bad thing.
The next example we look at is sourcing product out of season and how the charts can help us predict what the sales will be like when the product comes back into season.
The last example shows how to forecast sales of products that we might be sourcing wholesale or making large out of season purchases. It shows also how to use the charts of similar products when you are bringing new products to market.
Then the last thing we show is how to make it easier to access the charts when you are on a low budget and not using paid scanning apps.
This course show how to use charts for sourcing but more importantly, it shows how to think like a full time FBA reseller like myself thinks and sources.


Brandon P.
Being able to read the keepa charts should be your number one method in selling on amazon. The information is not outdated and probably never will be see that this is the only data the majority will have on amazon. He does a great job at going over the steps so all can understand.