Brief Summary
This course is your go-to guide for mastering SSRS Reports Development tailored for mobile devices. You'll go from zero to awesome as you learn to create interactive and analytical reports for all your favorite gadgets!
Key Points
-
Learn how to develop responsive mobile reports.
-
Hands-on exercises with real projects.
-
Direct access to a published author and industry expert.
Learning Outcomes
-
Understand the basics of SSRS and mobile analytics.
-
Develop fully functional dashboards for various mobile platforms.
-
Gain experience working with real-world client projects in data visualization.
About This Course
Learn to develop responsive, interactive & analytical SSRS Reports for iPads, iPhones, Android & Windows 10 Devices
PS: This course was originally titled Visual Analytics with SSAS and SSRS on iOS, Android and Windows 10. It has been re-branded as Mastering SSRS Reports Development for Mobile Devices
Top 4 Reasons to take this course:
1) You can learn Mobile Reporting and Visual Analytics that can be accessed on Mobile Platforms like iOS, Android and Windows 10 from scratch as well as ask questions directly to a Published Author, Microsoft MVP, and a Senior Technology Architect with more than 14 years of experience who actively practices Business Intelligence, Mobile Analytics, Data Visualizations, Data Mining and Data Analytics in real-world client projects internationally.
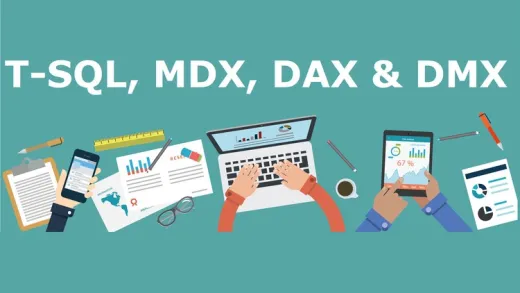
2) In a single course, without any prior SSAS experience - You can learn installation of SQL Server, SSAS and SSRS. Post installation you will learn how to consume data from SSAS multi-dimensional cube (which is composed of billions of rows typically) using MDX Query Designer into mobile dashboards for visual analytics by CxOs of an organization.
3) You get to train yourself on a number of analytical charts, graphs and gauges and understand the applicability of the same for different types of data and scenarios.
4) Downloadable Course Content:
10 Fully functional dashboards with desktops, tablet and mobiles layouts targeted for iOS, Android and Windows 10
1 Sample Multidimensional OLAP SSAS Database with sample data
50+ Custom geographical maps ( which are not available out-of-box )
All examples developed in the course
Short guides on using Charts and Graphs
Links to key resources
Course Description
Visual Analytics with SSAS and SSRS on iOS Android and Windows 10 is a course in which a student having no experience in analytics, reporting and visualizations would be trained step by step from basics. The intention of this course is to empower students with the knowledge of developing mobile dashboards for senior leadership of an organization like CEO, COO etc.
These skills can potentially yield salaries of $85 - $150k based only on your experience of data visualizations and mobile reporting techniques using Microsoft BI Tools using the latest version of SQL Server Analysis Services and SQL Server Reporting Services 2016.
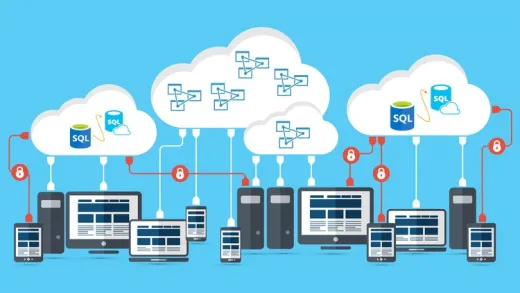
Course includes practical hands-on exercises as well as theoretical coverage of key concepts. Anyone pursuing this course would be able to clearly understand about Microsoft Business Intelligence Architecture, Microsoft Mobile Reporting Architecture and understand how SSAS fits in this architecture along with other tools like Power BI.
Downloadable course content - 10 fully-functional real-life complex dashboards, 55 custom designed shapes and maps, 1 Sample Multidimensional OLAP Database containing fully functional cube with sample data, curated reference material links, and all the examples developed in the course.
By end of this course, you should be able to work with actual clients, technology architects, or team leads on a large scale Reporting and Analytics project
Design and develop mobile dashboards specially designed and optimized for analytics and accessed from mobile, tablets and similar devices


Hazel M.
Lectures good, does not reply to questions, unable to connect to server and not blocked by firewall, cannot progress fully as not connected to SQL Server reporting services