Brief Summary
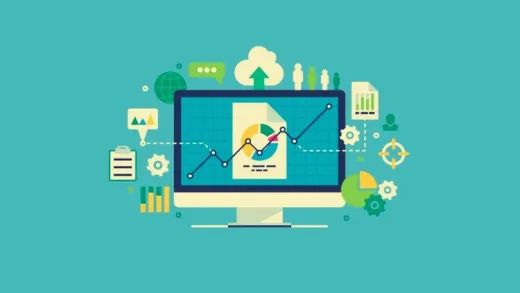
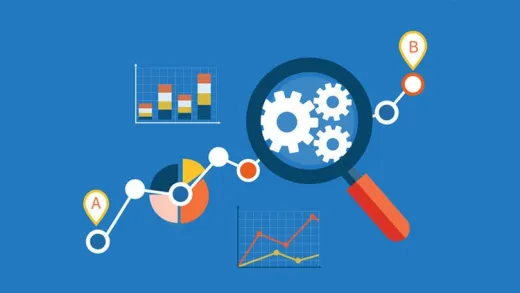
Dive into the exciting world of data visualization with our interactive Python course! You'll learn to craft beautiful charts, master different techniques, and understand your data like never before.
Key Points
-
Learn to create interactive visualizations with Python
-
Understand various chart types & best practices
-
Produce 3D animations and effective maps
Learning Outcomes
-
Ability to create custom data visualizations
-
Knowledge of chart types and data sources
-
Skill in using Python libraries like matplotlib
About This Course
Learn how to create interactive, engaging, and compelling visualizations with python.
Unleash the Power of Data: Master Interactive Data Visualization with Python!
In today's data-driven world, captivating visualizations are the key to unlocking the hidden stories within massive datasets. Are you ready to become an expert in crafting stunning, insightful charts and graphs? Look no further! Our immersive course on interactive data visualization with Python will elevate your skills to new heights.
Python is a versatile and powerful tool, enabling you to create high-impact data visualizations with ease and precision. Throughout this comprehensive course, you will journey from establishing a Python environment for data manipulation and visualization to producing mesmerizing 3D animations using cutting-edge Python libraries.
We will commence by delving into the fundamentals of data visualization, exploring various chart types, common pitfalls, best practices, and diverse data sources. By the end of this course, you will have mastered the art of using matplotlib in Jupyter Notebook, harnessing the potential of matplotlib styles, and deftly navigating subplots and small multiples.
Upon completing this transformative course, you will have unraveled the secrets behind crafting compelling data visualizations that captivate audiences and inspire meaningful insights. Don't miss this opportunity to become a skilled data visualization maestro—enroll now and embark on a remarkable journey towards data mastery!
Draw your first chart and customize it
Learn the best chart types based on your data source
Build effective maps with geo-based data


John T.
Brief, very informative course. Introduced me to a few skills I will definitely use. Could have included more examples or slightly more depth re customizing styles but still provided enough detail to get me going. would def recommend.