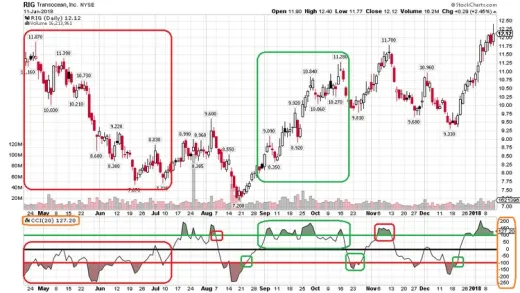
A Beginners Guide to Technical Analysis of Stock Charts

Master stock charting with 50 video lessons from a professional trader. Enhance your trading skills in Swing and Day Trading with essential techniques and indicators.

  • Overview
  • Curriculum
  • Instructor
  • Review

Brief Summary

This course is your go-to guide for understanding stock charts from an expert trader. With 50 engaging videos, you'll learn all the essential techniques and helpful indicators to boost your trading success, whether you're swinging or day trading.

Key Points

  • Learn how to read stock charts for Swing and Day Trading.
  • 50 video lessons totaling 8.5 hours of content.
  • Technical Indicators are explained and demonstrated.
  • Significant focus on practical application and real-world examples.
  • Final lesson addresses common pitfalls with indicator use.

Learning Outcomes

  • Become proficient in reading daily and weekly stock charts.
  • Understand and apply key Technical Indicators in your trading.
  • Learn to set up your stock charts effectively.
  • Develop a personalized approach to choosing the best indicators.
  • Engage in one-on-one discussions to refine your trading strategy.

About This Course

Learn all about charting from A-Z from an experienced Trader - Increase your odds of Success trading the Stock Market

Learn the techniques a full-time Professional Trader uses every day for Swing Trading and Day Trading. Analyzing daily charts and weekly charts is important when Swing Trading. To be a successful Day Trader, it is imperative to know how to quickly and correctly read stock charts.

These 50 video lessons, that total up to 8.5 hours of playtime, will teach you all about stock charts and the many Technical Indicators you can load onto them. The most common and useful indicators will be covered first, and after the 15th lecture, Stock Chart Setup #1 is presented, which is something you can start to use in your trading right away!

Each lesson begins with a brief explanation of each Technical Indicator. The majority of each 10 minute lesson is spent showing you exactly how an experienced trader uses them. Every video shows numerous chart examples of each indicator in Action.

The final lesson on "Multicollinearity" - or - "There are SO many indicators! Which ones do I USE?", explains how indicators are grouped, and how to avoid a common problem chartists have, by using too many of the same types of indicators on their charts. This lesson will show you how to choose your favorites from each category to get best results.

Questions from students will be answered promptly, and Live Sessions will be planned for one on one discussion about your favorite stock charts.

  • To help you to become a much more successful Trader

Instructor

Profile photo of Tom Watson
Tom Watson

I've been day trading and swing trading the stock market every day for 20 years, and have been teaching others how to do it since 2004. When I started trading I only knew how to do fundamental analysis, and had never paid much attention to charts.  Some of my on-line friends in stock market related forums were always talking about...

More Courses By Tom Watson
Review
4.9 course rating
4K ratings
ui-avatar of Quintin Thurman
Quintin T.
5.0
1 year ago

The lessons have been detailed with clear explanations.

  • Helpful
  • Not helpful
ui-avatar of Kat Lawson
Kat L.
5.0
1 year ago

Great detail for a newbie! Thank you.

  • Helpful
  • Not helpful
ui-avatar of Olakunle Oladimeji
Olakunle O.
3.5
2 years ago

Yes. I needed more information on charts patterns and how they work

  • Helpful
  • Not helpful
ui-avatar of Michael DeWayne King
Michael D. K.
3.0
2 years ago

Little dated. VWAP an "up and coming" indicator?

  • Helpful
  • Not helpful
ui-avatar of Edward Gonsalves
Edward G.
5.0
2 years ago

Love this program

  • Helpful
  • Not helpful
ui-avatar of Stella
Stella
5.0
3 years ago

it was an excellent match for me, I learned a lot, it is well explained, lots of great visual examples. Plus there is more for me to learn over time as I get more used to the technical indicators. I can "grow into it".

  • Helpful
  • Not helpful
ui-avatar of John Cheung
John C.
4.5
3 years ago

Good introduction for the basic technical indicator that every trader must know.

  • Helpful
  • Not helpful
ui-avatar of Guillermo Mathisen
Guillermo M.
5.0
3 years ago

Great course this is the go-to learn how to use the technical indicators I highly recommend this course

  • Helpful
  • Not helpful
ui-avatar of Kaizer V Badhniwalla
Kaizer V. B.
5.0
4 years ago

informative and good understanding

  • Helpful
  • Not helpful
ui-avatar of Excel I
Excel I.
4.5
4 years ago

Excellent Course. Really learned a lot about technical analysis. Well presented.

  • Helpful
  • Not helpful
Leave A Reply

Your email address will not be published. Required fields are marked *

Ratings

Courses You May Like

Lorem ipsum dolor sit amet elit
Show More Courses